DUST Protocol
DUST Otomatik İşlem
attach_money
Son Fiyat
0.033824$
trending_down
Günlük Değişim
-20.48%
shopping_bag
Piyasa Değeri
1.13 Milyon
DUST Protocol Yorumu
**DUST Coin Analysis and Price Prediction**
**Introduction:** DUST, currently trading at $0.037807, has shown a significant 24-hour price increase of 33.95%. This surge indicates strong short-term bullish momentum, making it crucial for investors to monitor technical levels for potential entry or exit points.
**Market Analysis:** The recent price surge in DUST is supported by a notable increase in trading volume, signaling robust investor interest. The EMA20 and EMA50, at $0.024393 and $0.025884 respectively, are below the current price, indicating bullish momentum. The EMA200 at $0.062834 suggests a strong uptrend. However, the RSI at 99.18 signals overbought conditions, hinting at a potential pullback. The MACD's bullish crossover reinforces the positive outlook.
**Technical Indicators:** - **EMA (20, 50, 200):** The current price above EMA20 and EMA50 indicates short-term bullishness, with EMA200 confirming a longer-term uptrend. - **RSI (14):** At 99.18, it's overbought, suggesting a possible correction. - **MACD:** Bullish crossover indicates upward momentum. - **Bollinger Bands:** Upper band at $0.031036 may act as resistance, with the basis at $0.022893 and lower at $0.014751. - **Fibonacci Levels:** Key resistance at R1 ($0.030128) and R2 ($0.034623), with support at S1 ($0.015575) and S2 ($0.011080).
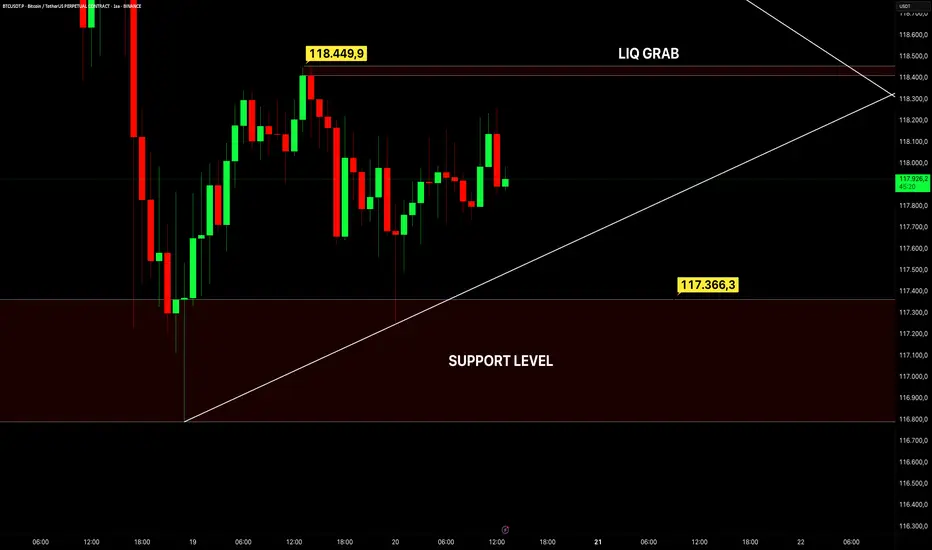
**Support and Resistance Levels:** - **Support:** S1 ($0.015575) and S2 ($0.011080). - **Resistance:** R1 ($0.030128) and R2 ($0.034623).
**Conclusion and Recommendations:** DUST's short-term outlook may see a correction due to overbought RSI, but the overall trend remains bullish. Investors should consider taking profits at R1 and R2 levels. Setting stop-losses near support levels is advisable. Remember, crypto investments carry risks, so diversification is key.
Follow us for daily crypto insights and stay updated on market trends.
**Introduction:** DUST, currently trading at $0.037807, has shown a significant 24-hour price increase of 33.95%. This surge indicates strong short-term bullish momentum, making it crucial for investors to monitor technical levels for potential entry or exit points.
**Market Analysis:** The recent price surge in DUST is supported by a notable increase in trading volume, signaling robust investor interest. The EMA20 and EMA50, at $0.024393 and $0.025884 respectively, are below the current price, indicating bullish momentum. The EMA200 at $0.062834 suggests a strong uptrend. However, the RSI at 99.18 signals overbought conditions, hinting at a potential pullback. The MACD's bullish crossover reinforces the positive outlook.
**Technical Indicators:** - **EMA (20, 50, 200):** The current price above EMA20 and EMA50 indicates short-term bullishness, with EMA200 confirming a longer-term uptrend. - **RSI (14):** At 99.18, it's overbought, suggesting a possible correction. - **MACD:** Bullish crossover indicates upward momentum. - **Bollinger Bands:** Upper band at $0.031036 may act as resistance, with the basis at $0.022893 and lower at $0.014751. - **Fibonacci Levels:** Key resistance at R1 ($0.030128) and R2 ($0.034623), with support at S1 ($0.015575) and S2 ($0.011080).
**Support and Resistance Levels:** - **Support:** S1 ($0.015575) and S2 ($0.011080). - **Resistance:** R1 ($0.030128) and R2 ($0.034623).
**Conclusion and Recommendations:** DUST's short-term outlook may see a correction due to overbought RSI, but the overall trend remains bullish. Investors should consider taking profits at R1 and R2 levels. Setting stop-losses near support levels is advisable. Remember, crypto investments carry risks, so diversification is key.
Follow us for daily crypto insights and stay updated on market trends.