Axelar
AXL Otomatik İşlem
attach_money
Son Fiyat
0.40151$
trending_up
Günlük Değişim
8.44%
shopping_bag
Piyasa Değeri
485.51 Milyon
Axelar Yorumu
AXL (Axelar) Analizi: Güncel Piyasa Görünümü ve Beklentiler
# Piyasa Genel Görünümü
Axelar (AXL), son períododa kripto piyasalarındaki genel volatiliteye paralel bir hareket gösteriyor. AXL/USD pairi, son 24 saatte %7.75 oranında artış kaydetti ve şu anda 0.39988 USD seviyesinde işlem görüyor. Piyasa değeri (market cap) 401.5 milyon USD düzeyinde bulunuyor. Kısa vadeli beklentiler, AXL'in 0.42 - 0.45 USD aralığında hareket edebileceğini gösteriyor. Ancak, genel piyasa sentimentinin ve teknik göstergelerin yakından takip edilmesi gerekiyor.# Piyasa Analizi
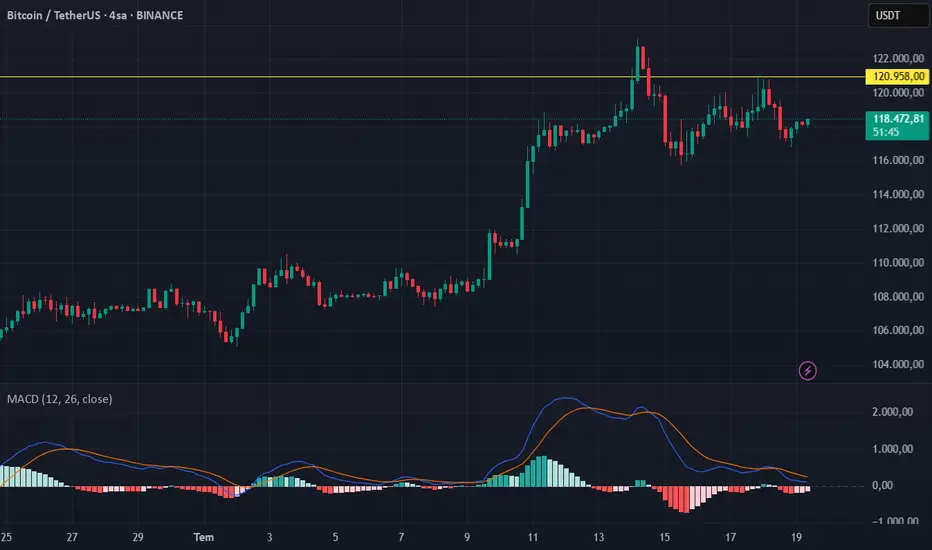
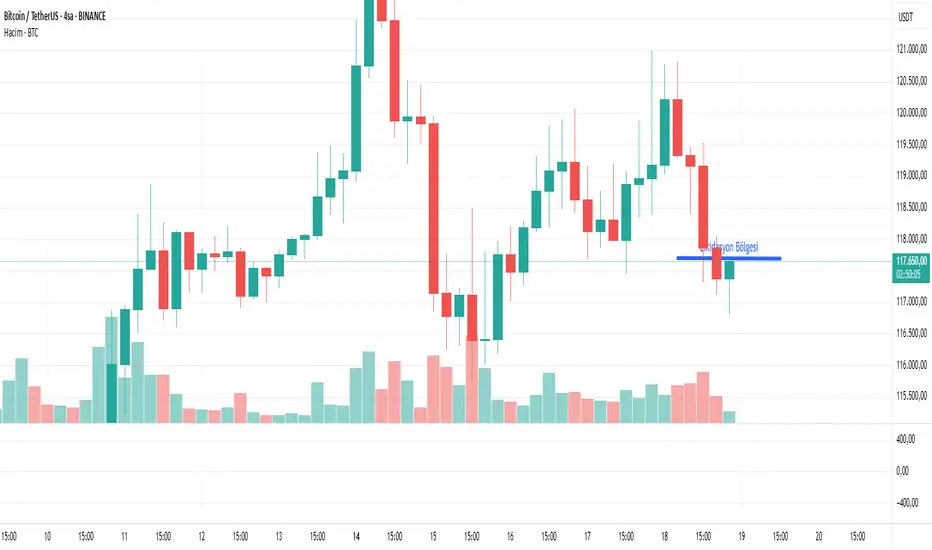
Teknik açıdan incelendiğinde, AXL'in 50 ve 200 günlük üsüt fiyat ortalamaları (EMA) arasında bir çaprazlama olması bekleniyor. EMA50 (0.3568) ve EMA200 (0.4361) arasındaki fark, AXL'in orta vadeli trendinde belirsizlik olduğunu gösteriyor. Ayrıca, RSI (14) değeri 84.65 seviyesinde ve bu durum, AXL'in aşırı alındığını (overbought) işaret ediyor. Bu durum, kısa vadeli bir geri çekilme olasılığını artırabilir. MACD göstergesinde ise sinyal hattının üzerine çıkmaya devam ediyor ve bu, alıcıların piyasada daha aktif olduğunu gösteriyor. Ancak, hacimlerin son dönemde düşüş eğiliminde olması, bu hareketin sürdürülebilirliği konusunda şüpheler oluşturuyor. Bollinger Bantları'na göre, AXL'in üst bandı 0.3963 ve alt bandı 0.2983 seviyesinde. Fiyatların bu bantlar arasında kalması, orta vadeli bir konsolidasyon dönemi olabileceğini gösteriyor. Fibonacci seviyelerinde ise, AXL'in 0.419 seviyesi önemli bir direnç noktası olabilirken, 0.2925 seviyesi ise güçlü bir destek olarak değerlendiriliyor.# Destek ve Direnç Seviyeleri
- **Direnç Seviyeleri:** - **0.419 USD (Fibonacci R1):** Bu seviye, AXL'in yukarı yönlü hareketlerinde önemli bir engel oluşturabilir. - **0.5458 USD (Fibonacci R2):** Bu seviye, daha uzun vadeli bir ralli durumunda kritik bir direnç noktası olabilir.- **Destek Seviyeleri:** - **0.2925 USD (Fibonacci S1):** Bu seviye, AXL'in aşağı yönlü hareketlerinde önemli bir destek olabilir. - **0.2143 USD (Fibonacci S2):** Bu seviye, daha derin bir geri çekilme durumunda test edilebilir.
# Sonuç ve Öneriler
AXL'in kısa vadeli görünümü, RSI'nin aşırı alındık seviyesine ulaşması nedeniyle dikkatle takip edilmeli. Yatırımcılar, 0.419 USD direncinin kırılmasını bekleyebilir veya 0.2925 USD desteğinde pozisyonlarını güçlendirebilir. Orta vadeli olarak, EMA50 ve EMA200'nin çaprazlanması, AXL'in trendini belirlemede önemli olacak. Yatırımcılar, risk yönetimine dikkat etmeli ve stop-loss seviyelerini belirlemelidir. AXL gibi volatil kripto paralarda, pozisyon boyutunu küçük tutmakrecommended.Günlük kripto analizleri ve yeni gelişmeler için bizi takip edin!