Apertum
APTM Otomatik İşlem
attach_money
Son Fiyat
1.3221$
trending_up
Günlük Değişim
1.83%
shopping_bag
Piyasa Değeri
2.78 Milyar
Apertum Yorumu
APTM Analizi: Piyasa Trendleri ve Teknik Görünüm
APTM, son dönemde kripto para piyasalarında dikkat çekici bir performans gösteriyor. current price of APTM is $1.2784, with a 24-hour price change of +30.60%. The market cap is calculated as $4,984,848.50. The asset has shown significant volatility in recent days, making it a focus for both short-term traders and long-term investors.
# Piyasa Analizi
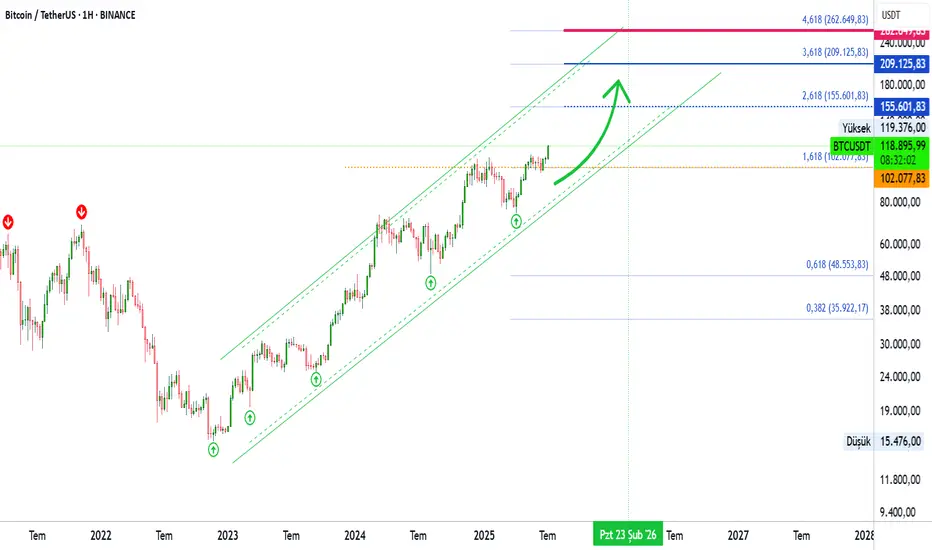
APTM'nin teknik analizi, several key indicators that suggest a bullish trend in the short term. The EMA (50) value of $1.1321 is above the EMA (20) value of $1.1079, indicating a bullish crossover. However, the RSI (14) value of 27.98 suggests that the asset is in the oversold zone, which could lead to a potential pullback in the near term. The MACD line is currently above the signal line, which is a bullish signal, but the convergence of these lines could indicate a potential trend reversal.
# Destek ve Direnç Seviyeleri
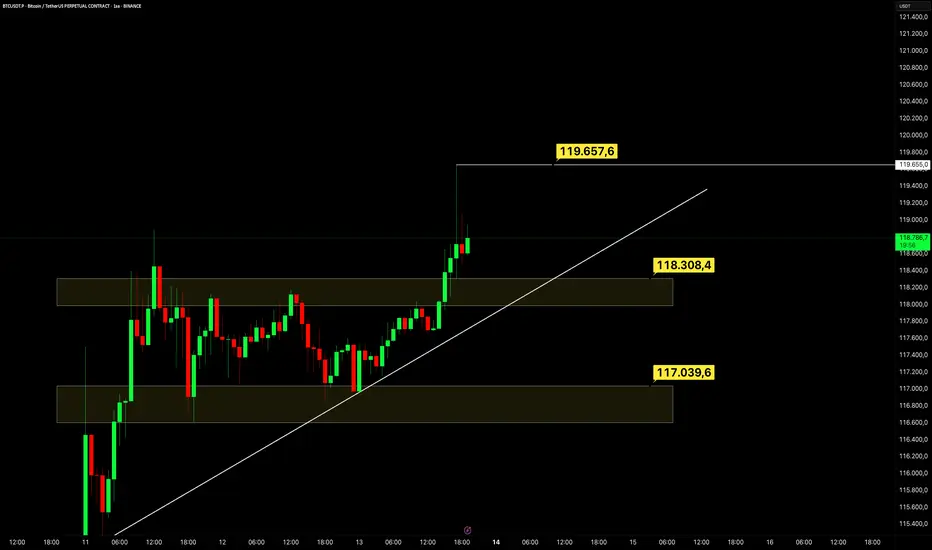
- **Direnç Seviyeleri:** - **R1 ($1.2899):** This is the first major resistance level, which is a critical level to watch. A breakout above this level could lead to further upward momentum. - **R2 ($1.4804):** This is a stronger resistance level, and a breakout above this level would indicate a significant bullish trend.
- **Destek Seviyeleri:** - **S1 ($0.9817):** This is the first major support level, and it is crucial for maintaining the current bullish trend. A breakdown below this level could lead to a correction. - **S2 ($0.4829):** This is a secondary support level, and it would act as a safety net in case of a deeper correction.
# Teknik Göstergeler
- **EMA (50) vs. EMA (200):** The EMA (50) is currently above the EMA (200), which is a bullish signal. However, the EMA (200) is not available due to insufficient data. - **RSI (14):** The RSI is currently in the oversold zone, which suggests that a pullback could be imminent. - **MACD:** The MACD line is above the signal line, indicating a bullish trend. However, the convergence of these lines could lead to a trend reversal. - **Bollinger Bands:** The upper Bollinger Band is at $1.3730, and the price is currently near this level, suggesting that the asset is overbought. - **Fibonacci Levels:** The Fibonacci levels suggest that the asset is currently testing the R1 level, and a breakout above this level could lead to further gains.
# Sonuç ve Öneriler
In conclusion, APTM shows a bullish trend in the short term, but the RSI and Bollinger Bands suggest a potential pullback. Traders should consider taking profits at the R1 level and should be cautious of a potential correction. Long-term investors should monitor the support levels and consider accumulation if the price corrects to the S1 level. As always, risk management is crucial in volatile markets like cryptocurrencies. Stay tuned for daily crypto analysis and market updates.
Apertum Fikirleri
Benzer Coinler
|
Coinbase tokenized stock (xStock)
Son Fiyat - 384.04$
|
arrow_forward |
|
Pope meme
Son Fiyat - 0.0035755$
|
arrow_forward |
|
HAVAH
Son Fiyat - 0.0012105$
|
arrow_forward |
|
RingDAO
Son Fiyat - 0.0011929$
|
arrow_forward |
|
Defiant
Son Fiyat - 0.000250065$
|
arrow_forward |